 Statistical Bulletin for Producer Price Index, February 2014
Table of contents
Producer Price Inflation Summary
- 0.5% increase in output price index for goods produced by UK manufacturers
(factory gate prices) in the year to February - Factory gate prices saw no movement between January and February
- Core factory gate prices rose 1.1% in the year to February
The output price indices measure change in the prices of goods produced by UK manufacturers (these are often called 'factory gate prices').
The input price indices measure change in the prices of materials and fuels bought by UK manufacturers for processing. These are not limited to just those materials used in the final product, but also include what is required by the company in its normal day to day running.
Output price ‘factory gate’ annual inflation for all manufactured products rose 0.5% in the year to February, compared with a rise of 0.9% in the year to January. Month on month the output price measure for all manufactured products saw no movement between January and February, compared with a rise of 0.3% between December 2013 and January 2014. The ‘narrow’ output price measure, which leaves out volatile sectors, rose 1.1% in the year to February, compared with a rise of 1.2% in the year to January.
Input price annual inflation fell 5.7% in the year to February, compared with a fall of 2.9% in the year to January. Month on month, the input price measure of UK manufacturers’ materials and fuels, fell 0.4% between January and February, compared with a fall of 0.9% between December 2013 and January 2014. The ‘narrow’ input price measure fell 5.3% in the year to February. In seasonally adjusted terms there was a fall of 1.1% between January and February.
What is Producer Price Inflation (PPI)?
The Producer Price Index (PPI) is a monthly survey that measures the price changes of goods bought and sold by UK manufacturers and provides a key measure of inflation, alongside other indicators such as the Consumer Prices Index (CPI) and Services Producer Prices Index (SPPI). This statistical bulletin contains a comprehensive selection of data on input and output index series. It contains producer price indices of materials and fuels purchased and output of manufacturing industry by broad sector.
The output price indices measure change in the prices of goods produced by UK manufacturers (these are often called 'factory gate prices').
The input price indices measure change in the prices of materials and fuels bought by UK manufacturers for processing. These are not limited to just those materials used in the final product, but also include what is required by the company in its normal day to day running.
Imported Price Indices (IPIs) are a series of economic indicators that measure change in the prices of goods and raw materials imported into the UK. IPIs are a key component of input price indices.
Exported Price Indices (EPIs) are a series of economic indicators that measure change in the prices of goods manufactured in the UK but destined for export markets.
The factory gate price (the output price) is the price of goods sold by UK manufacturers, and is the actual cost of manufacturing goods before any additional charges are added which would give a profit. It includes costs such as labour, raw materials and energy, as well as costs such as interest on loans, site/ building maintenance or rent.
Core factory gate inflation excludes price movements from food, beverages, petroleum and tobacco & alcohol products, which tend to have volatile price movements. It should give a better indication of the underlying output inflation rates.
The input price is the cost of goods bought by UK manufacturers for the use in manufacturing, such as the actual cost of materials and fuels bought for processing.
Core input inflation strips out purchases from the more volatile food, beverage, tobacco and petroleum industries to give an indication of the underlying input inflation pressures facing the UK manufacturing sector.
Get all the tables for this publication in the data section of this publication .
Supplementary analysis - Output prices
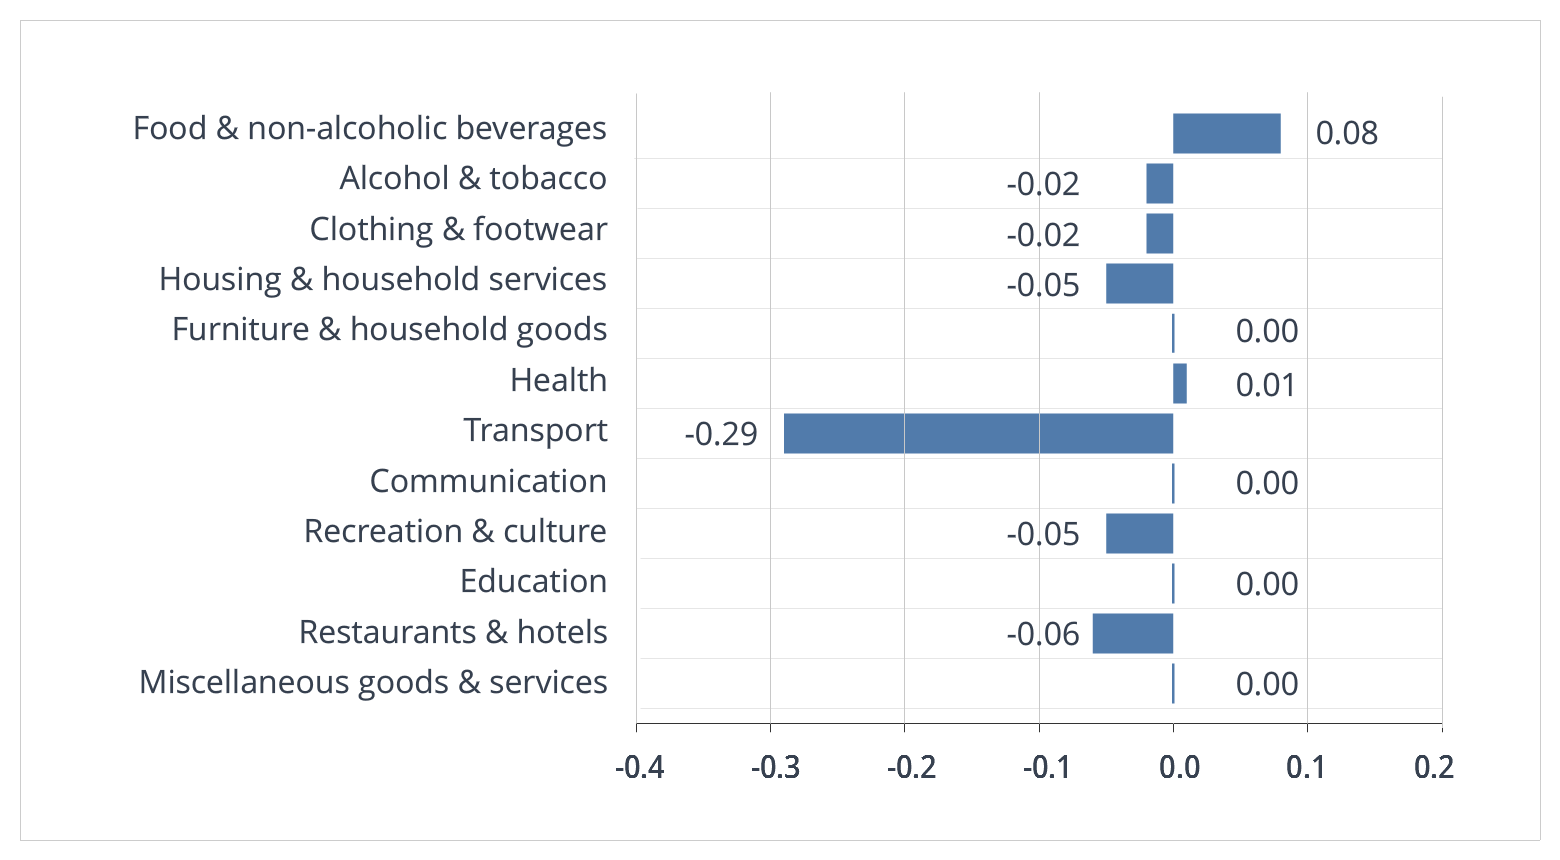
Table B shows the annual percentage change in price across all product groups and Figure B shows their contribution to the annual factory gate inflation rate. Table C and Figure C show the same information but for the monthly factory gate inflation rate.
Table B: 12 months change to February 2014
| Product Group | Percentage change |
|---|---|
| Food products | 1.6 |
| Tobacco & alcohol | 1.9 |
| Clothing, textiles & leather | 2.3 |
| Paper & printing | 1.2 |
| Petroleum products | -7.3 |
| Chemicals & pharmaceuticals | -1.9 |
| Metal, machinery & equipment | 0.8 |
| Computer, electrical & optical | 1.6 |
| Transport equipment | 0.4 |
| Other manufactured products | 1.4 |
| All manufacturing | 0.5 |
Figure B: Contribution to 12 months growth rate (0.5%), February 2014
Source: Index Numbers of Producer Prices (PPI): Provision of Price Information -Office for National Statistics