 Statistical Bulletin for Producer Price Index, February 2014
Table of contents
Supplementary analysis - Output prices
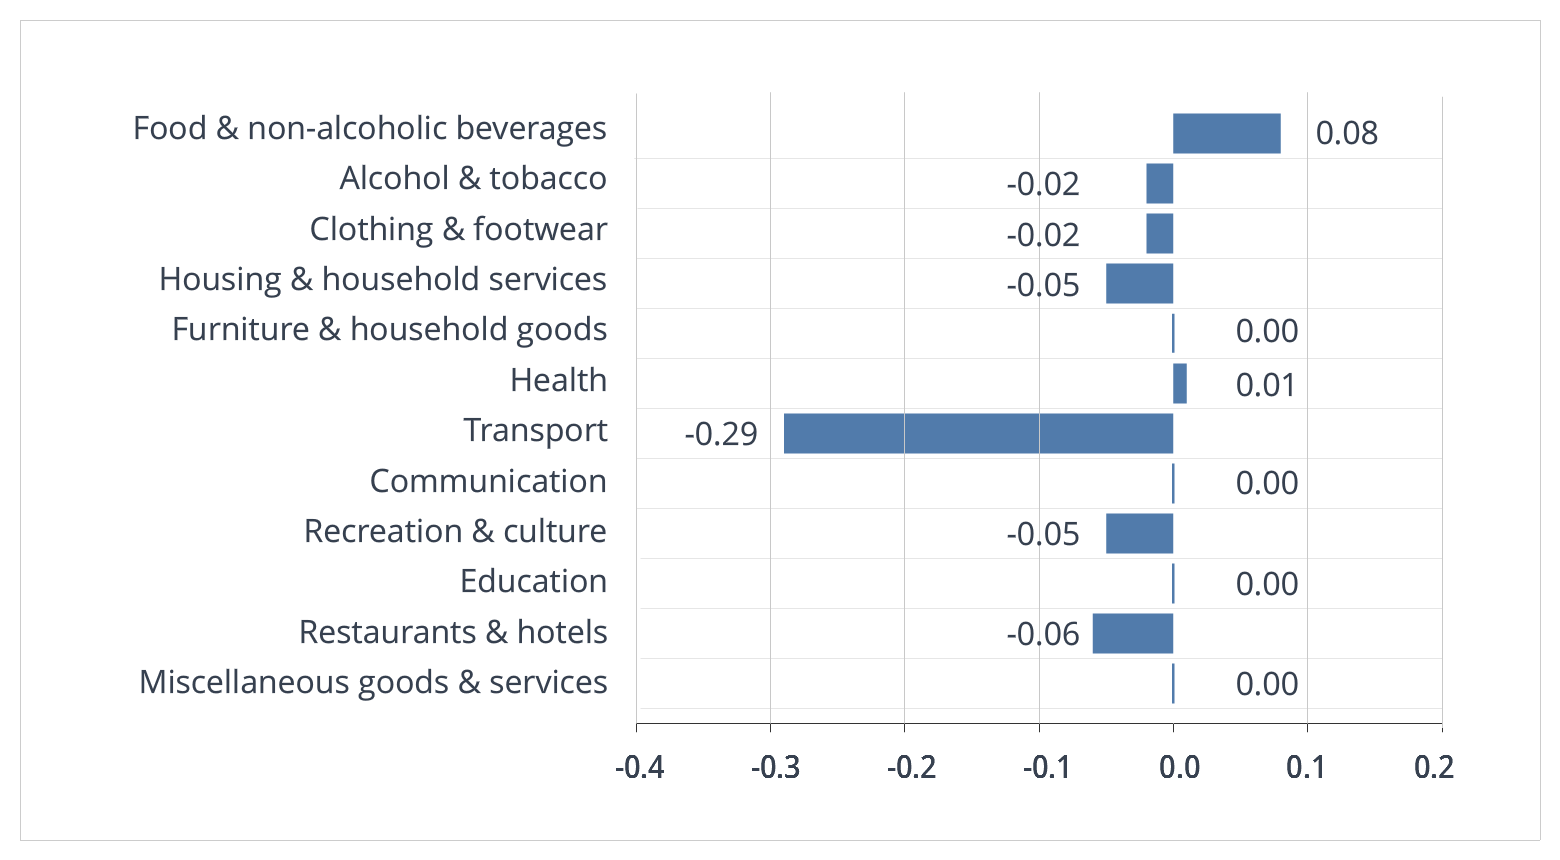
Table B shows the annual percentage change in price across all product groups and Figure B shows their contribution to the annual factory gate inflation rate. Table C and Figure C show the same information but for the monthly factory gate inflation rate.
Table B: 12 months change to February 2014
| Product Group | Percentage change |
|---|---|
| Food products | 1.6 |
| Tobacco & alcohol | 1.9 |
| Clothing, textiles & leather | 2.3 |
| Paper & printing | 1.2 |
| Petroleum products | -7.3 |
| Chemicals & pharmaceuticals | -1.9 |
| Metal, machinery & equipment | 0.8 |
| Computer, electrical & optical | 1.6 |
| Transport equipment | 0.4 |
| Other manufactured products | 1.4 |
| All manufacturing | 0.5 |
Figure B: Contribution to 12 months growth rate (0.5%), February 2014
Source: Index Numbers of Producer Prices (PPI): Provision of Price Information -Office for National Statistics
Explore
Subscribe
Latest Data
We need your feedback
Can you spare us two minutes to tell us how we are doing?