Prototype:
Create an MVP map prototype
1. This is dummy copy
In 2012 to 2014, males at birth in England could expect to spend a higher proportion (79.7%) of their remaining lives in “Good” health, compared with females (76.9%).
London had the largest inequality in healthy life expectancy (HLE) at birth between upper tier local authorities (UTLAs) for males and females at 13.6 years and 17.6 years respectively.
At birth, males in Wokingham could expect to live 15.5 years longer in “Good” health than males in Blackpool (70.5 years compared with 55.0 years).
At birth, females in Richmond upon Thames could expect to live 17.8 years longer in “Good” health than females in Manchester (72.2 years compared with 54.4 years).
There were 20 UTLAs for males and 25 UTLAs for females that had a significantly higher HLE than the current state pension age of 65.
For women at age 65, London had a significantly lower HLE than the England average at 10.9 years, despite having a higher life expectancy (LE) than any other part of the country.
Harrow had the largest significant improvements in HLE since 2009 to 2011, for males at birth and men at age 65 (5.7 years and 4.7 years respectively).
In the most deprived areas, males at birth could expect to live 19.0 years less of their lives in “Good” health compared with the least deprived areas as measured by the slope index of inequality (SII). For females, it was 20.2 years less.
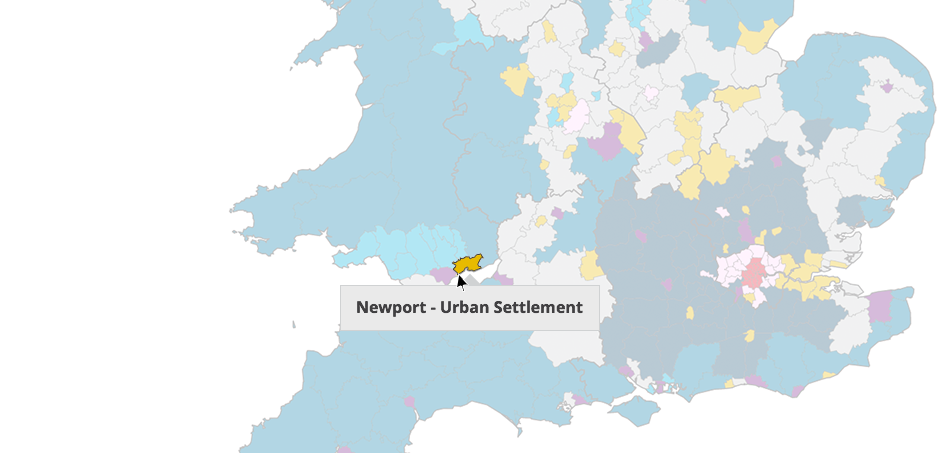
Figure 1: 2011 Area Classification for Local Authorities in the UK: Supergroups
| Affluent England | Business, Education and Heritage Centres | Countryside Living | |||
| Ethnically Diverse Metropolitan Living | London Cosmopolitan | Services and Industrial Legacy | |||
| Town and Country Living | Urban Settlements |
Source: Office for National Statistics licensed under the Open Government Licence v.3.0
Notes:
- Space for useful footnotes
- Space for even more useful footnotes
Download this map
Image .xls .csv
Use of a tool tip